
Teacher Dashboard Guide: Coral Academy
Teacher Dashboard Guide: Coral Academy
At Coral Academy, we’re here to make your teaching experience as seamless and empowering as possible. That’s why we have built the “Teacher Dashboard” — designed to help you track your class performance, monitor attendance, and stay organized with upcoming sessions.
From real-time metrics to session breakdowns, this dashboard aims to give you a clear picture of how your classes are doing, so you can focus on what matters most: creating engaging classroom experiences for your learners.
Below, you’ll find a step-by-step walkthrough to help you get the most out of this feature.
Accessing the Teacher Dashboard
To access your Teacher Dashboard:
- Log in to your Teacher Panel.
- Click on the Dashboard button from the sidebar.
And that's it! You’ll be taken to your Dashboard, where you can view your metrics in real-time and manage your sessions without any hassle.
Metrics Overview
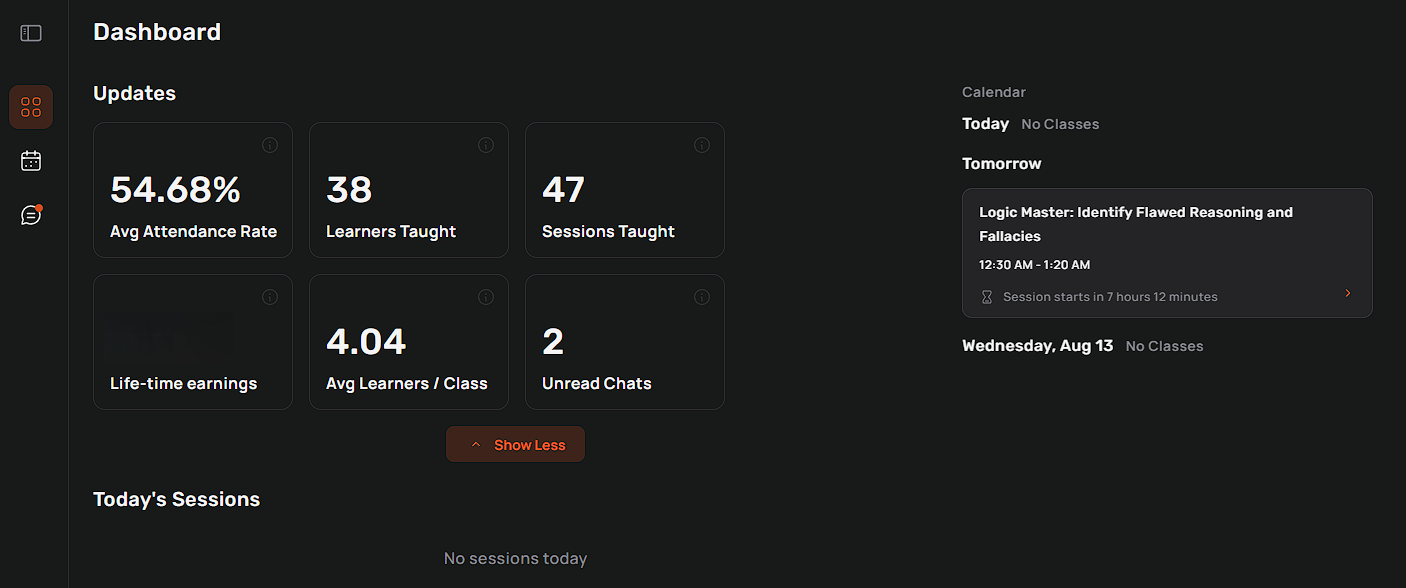
At the top of your dashboard, you’ll see your Metrics Overview. This section gives you a quick snapshot of your key performance indicators. By default, you’ll see the top 3 metrics, and you can click on the “Show More” button to see additional details.
Here’s a quick breakdown of the most important metrics you’ll find:
- Average Attendance Rate:
Percentage of enrolled learners who attended your classes. If someone joins for even a minute, they count as present.
[(Total number of learners attended across all sessions of a class ÷ Total number of learners enrolled across all sessions of a class) × 100] - Learners Taught:
Total number of distinct or unique learners you've taught. Each learner is counted once, even if they've attended multiple classes. - Sessions Taught:
The number of distinct class sessions you’ve completed so far on the platform. (Canceled sessions aren’t counted — but if you started a session and no one showed up, it still counts.). - Lifetime Earnings: Total earnings from all your sessions so far.
Note: Only visible to independent teachers and organisation owners. - Avg Learners/Class:
Average number of learners who have attended your sessions.
[(Total number of learners attended across all sessions)/(Total number of sessions taught by the teacher)] - Unread Chats:
The number of unread messages in your inbox to help you stay on top of your parent communication!
Quick Note: All of these numbers update in real-time, so they always reflect your latest data.
Upcoming Classes View
On the right side of your dashboard, you’ll find the Upcoming Classes section — a quick glance at what’s coming up next in your teaching schedule.

Here’s what you’ll see:
- Class Date & Time
Each upcoming session is listed with its scheduled date and time.
(Sessions happening today, tomorrow, & the day after are automatically highlighted for easier visibility.)
- Countdown Timer
A real-time countdown showing exactly how much time is left before your next session begins.
- Session Details:
Click on any session to be redirected directly to the classroom page for that session.
Today’s Sessions View
Right below the Metrics Overview, you’ll find the “Today’s Sessions” banner. This section gives you a quick view of your next session happening today.
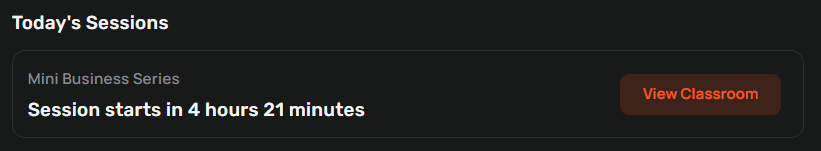
- Class Title:
Your class names will be displayed in the banner.
- Countdown Timer:
The timer tells you exactly how much time is left before the session starts.
You will see the timer in
Green colour - if the session starts in <15 mins from current time.
Red colour - if the session has already started. - View Classroom Button:
That allows you to access the “classroom page” directly.
Session Breakdown (This Week/Month)
In the Session Breakdown table, you can easily see a detailed summary of your past sessions, either for This Week or This Month. This table is designed to give you a quick look at both your enrollments and attendance for each session.
Here’s what you’ll find in the table:
- Class Name
You’ll see a short version of the class name, like ‘Geology Adventures’ or ‘History Investigators’. If you hover over the name, you’ll get a tooltip with the full class title. - Session Date
This shows the date on which the session took place. The date will be displayed in your local timezone, so you don’t need to worry about time zone differences. - Session Time
The time at which the session was held, displayed in the format of 5 PM - 5:50 PM PST (in your local timezone). - Number of Enrollments
This shows how many learners were enrolled in the session as of the session's start time. Any enrollments made after the session started won’t be counted for that session. - Attendance Count
This shows the number of learners who actually attended the session, in the format “2/15” (e.g., 2 learners attended out of 15 enrolled).
You can click on this number to open the Session Replay modal for that specific session. It’s a great way to review the session details and track any attendance patterns.
- Filter by Week or Month:
At the top of the table, there’s a filter dropdown that allows you to switch between This Week and This Month. If you choose This Week, the title will dynamically update to show classes “This Week”, and similarly for This Month. - Clear Filter:
You can easily clear the filter by clicking the ‘cross’ button next to the filter. This will reset the table to its default view. - Rows per page:
Lets you choose how many sessions are shown at once in your session breakdown table.
For example, if you select 10, you’ll see up to 10 sessions per page — and you can use the arrows below to move between pages if there are more sessions to view.
This section helps you stay on top of your teaching history, and it’s a great way to reflect on your past sessions. If you need to dive deeper into a particular session, just click the “Attendance Count” to watch the Session Replay. (Refer to the video snippet below for a better idea)

Key Pointers:
- Non-expanded View:
Initially, you’ll see only the top 3 metrics in a simple layout. Click on “Show More” to view all your metrics. - Expanded View:
When you click “Show More”, all of your metrics will appear. Each metric will include an “i” icon, which you can hover over to get a quick explanation of what it means. - Upcoming Classes Calendar:
You’ll also see a clear, readable calendar(on the right side of your dashboard) of your upcoming classes, showing the date and time of each session.
Below is a visual reference to help you understand the navigation better.
Your Teacher Dashboard is your all-in-one space to monitor your teaching activity, manage sessions, and understand what’s working out.
If you ever need help navigating your dashboard or have questions about any of the features, we’re here for you. Just drop us a line at teachers@coralacademy.com — we’d love to help!